ABSTRACT:
Exhaled Breath Condensate (EBC) is easy to collect using the RTube and can be used as a tool in clinical and diagnostic research. Data was recorded on how much exhaled breath condensate the RTube collects at different timepoints over a ten-minute span under normal indoor conditions (~25oC) from a single subject. The cooling sleeve initial temperature of -7oC was the same for all runs regardless of duration, and the final temperature varied roughly proportionally with the collection duration of the run up to a maximum of 13oC at ten minutes. Within the stated range, the condensate per minute yield was nearly constant at 0.185 ml/min for this particular subject confirming our hypothesis of a linear relationship between collection time and condensate yield. This further suggests that, within the range discussed in this paper, temperature can rise 20oC during the collection and essentially have no effect on the collection efficiency and condensation yield.
INTRODUCTION:
Exhaled Breath Condensate (EBC) has been collected in clinical studies for over two decades because it is a rich source of measurable biomarkers originating in the airway that can provide valuable information about respiratory as well as systematic disease (Aytekin et al, 2008)1. The RTube Exhaled Breath Condensate Collector is the standard for collection of EBC and is designed as a disposable, single use device. The system is designed for ease of use even in exceptionally large clinical studies. This experiment will be recording the yield of EBC in a volunteer at different collection durations in order to determine the performance characteristics of the RTube device. The RTube, a product of Respiratory Research Inc. in Austin, TX has been used over 200,000 times in clinical settings since 2005. This continuous support of the breath research community has assisted researchers across the world to better understand breath science, and how this non-intrusive method may be used for future diagnostics.

The RTube Exhaled Breath Condensate Collector is a single-use disposable device chilled by a reusable metal cooling sleeve (Respiratory Research Item # 3001). This device is passive in that it is chilled in a household freezer then applied to the RTube where it equilibrates to room temperature over time. It is coldest at the beginning of the collection, and by the end of the collection will have warmed to some degree. In a study done by BMC Pulmonary Medicine, evidence shows total condensate volume increased as temperature decreased (Andreoli, et al 2005)2. Inversely, as temperature increases, total condensate volume decreases. While this makes sense over larger temperature swings, it is our goal in this study to show that, within a range of roughly -10 oC to +15 oC and starting at the lower end, the actual collection temperature at any given time point in the collection process has little to no measurable effect on condensate yield up to that time point.
METHOD:
The general instructions for collecting EBC are posted on the manufacturer’s website at https://respiratoryresearch.com/rtube/ . We will adhere to these instructions for all collections, but some steps will be further detailed below as they were specific to this study. Five collection runs will be done from a single test subject, recording the initial dry weight of the RTube, the weight of the RTube at the end of the collection run, and determining the volume of fluid collected based on the differences in weight. The length of each progressive collection run will increase by two minutes. The temperature of the aluminum condenser will be recorded at one-minute intervals throughout each collection run. Condensate yield will be determined by weighing the RTube before and after the collection.
Materials and Tools Used for This Experiment:
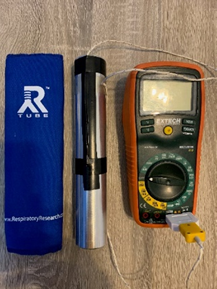
- RTube Exhaled Breath Condensate Collector System (Respiratory Research, Austin, TX USA)
- EX410 Digital Multimeter with Temperature (ExTech, Nashua, NH, USA)
- TP873 Bead Wire Type K Temperature Probe (ExTech, Nashua, NH, USA)
- Household kitchen freezer (Temperature to be at -12oC or below)
- Airlife Incentive Spirometer (Carefusion, San Diego, CA, USA)
- L125 Maximum Precision Digital Scale (Escali, Burnsville, MN, USA)
- iPhone used as a timer (Apple, Cupertino, CA USA)
Study Subject:
The subject for this experiment was a healthy 25-year-old Caucasian male. His weight was recorded at 173 lbs., and a height of 5 feet 8 inches. Using the 3500 ml capacity Carefusion Airlife Incentive Spirometer, his lung capacity was measured at 3300 ml.
Instrumenting the Cooling Sleeves:
A single thermocouple was taped to each of two aluminum cooling sleeves using black electrical tape. The K type thermocouple wires were taped to the middle section of the aluminum cooling sleeve to provide the most accurate internal temperature during the experiment. They were dried completely with paper towels, then placed in separate plastic bags to control moisture, then placed inside a kitchen freezer until the temperature of the cooling sleeve reached -12oC. This took approximately 100 minutes to be achieved.

While the RTube aluminum cooling sleeve was in the freezer, other materials for the experiment were organized on a lab bench and the new, unused RTube was weighed. The temperature of the cooling sleeve was checked intermittently until the temperature of the RTube aluminum cooling sleeve reached – 12oC. The sleeve then was removed and immediately equipped with the RTube insulating sleeve. By the time the RTube aluminum cooling sleeve was equipped with the RTube insulating sleeve, the temperature of the cooling sleeve had risen to -9 oC. To ensure consistency between all runs, and to ensure the trial runs all began at the same time, the temperature was constantly observed. At the moment the displayed temperature changed from -8 oC to -7 oC, the first trial run began. Exactly 2 minutes after beginning, the volunteer stopped breathing into the RTube. Immediately after the use of the RTube, the aluminum cooling sleeve was removed, then the RTube collection chamber was removed and weighed. To determine the yield of breath condensate for collection one, the change of weight was determined by subtracting the final weight from the initial weight. Since the yield of EBC had been recorded, the RTube was discarded. For this experiment, all EBC collected was disposed of without any analysis of the sample being done.
This process was repeated, with each subsequent collection adding two minutes of duration up to a maximum of 10 minutes. These 5 collection runs were done 3 separate times totaling 15 collection runs with 3 collections being done at each time interval. To ensure the data collected using the RTube is consistent between runs, and throughout each experiment group the ambient temperature and the temperature of the freezer used were be closely monitored. The ambient temperature must be equal to 20+/- 5 oC for all runs. To record an accurate and consistent ambient temperature, the thermometer was left in the experimentation room away from sunlight, and equidistance from the floor to the ceiling. A home freezer was used to chill the cooling sleeve to about -20 degrees Celsius. This change in temperature should take about an hour and a half while the sleeve is in the freezer.
RESULTS:
Through the 15 collection runs, a steady collection of EBC was seen for the 2 minute collections. During the 4 minute collections, there was a slight decrease in collection, but the consistency resumed for the 6 and 8 minute collections. There was a steep decline in EBC collection after the cooling sleeve reached 9 oC during the first 10 minute collection with only a 0.09g increase of EBC being collected between the fourth and fifth trial run. This was only seen for the first 10 minute collection and was not a consistent result with the second and third 10 minute collection.
| Temperature © | Minutes | 2 | 4 | 6 | 8 | 10 | ΔW (g) |
| T0 | 0 | -7 | -7 | -7 | -7 | -7 | |
| T1 | 1 | -3 | -4 | -4 | -5 | -3 | |
| T2 | 2 | 0 | -1 | -1 | -2 | 0 | 0.38 |
| T3 | 3 | 0 | 0 | 0 | 1 | ||
| T4 | 4 | 1 | 2 | 1 | 2 | 0.72 | |
| T5 | 5 | 3 | 3 | 4 | |||
| T6 | 6 | 6 | 6 | 6 | 1.11 | ||
| T7 | 7 | 7 | 7 | ||||
| T8 | 8 | 9 | 10 | 1.60 | |||
| T9 | 9 | 12 | |||||
| T10 | 10 | 13 | 1.69 |
| Temperature © | Minutes | 2 | 4 | 6 | 8 | 10 | ΔW (g) |
| T0 | 0 | -7 | -7 | -7 | -7 | -7 | |
| T1 | 1 | -2 | -2 | -2 | -3 | -4 | |
| T2 | 2 | -2 | -2 | -1 | 0 | -1 | 0.41 |
| T3 | 3 | 1 | 0 | 1 | 0 | ||
| T4 | 4 | 2 | 2 | 3 | 2 | 0.73 | |
| T5 | 5 | 3 | 4 | 3 | |||
| T6 | 6 | 7 | 6 | 6 | 1.09 | ||
| T7 | 7 | 7 | 7 | ||||
| T8 | 8 | 10 | 10 | 1.42 | |||
| T9 | 9 | 12 | |||||
| T10 | 10 | 13 | 1.74 |
| Temperature © | Minutes | 2 | 4 | 6 | 8 | 10 | ΔW (g) |
| T0 | 0 | -7 | -7 | -7 | -7 | -7 | |
| T1 | 1 | -2 | -3 | -2 | -5 | -3 | |
| T2 | 2 | -1 | -2 | 0 | -2 | 0 | 0.34 |
| T3 | 3 | 0 | 0 | 1 | 0 | ||
| T4 | 4 | 2 | 2 | 2 | 1 | 0.71 | |
| T5 | 5 | 3 | 3 | 3 | |||
| T6 | 6 | 6 | 6 | 6 | 1.08 | ||
| T7 | 7 | 8 | 7 | ||||
| T8 | 8 | 9 | 9 | 1.41 | |||
| T9 | 9 | 12 | |||||
| T10 | 10 | 13 | 1.67 |
- The 2-minute collection runs resulted in an average yield of 0.377g of EBC with the average temperature () of the cooling sleeve at the end of the two minute collection runs being -1 o
- The 4-minute collection runs resulted in an average yield of 0.720g of EBC, an increase of 0.343g from the 2 minute collection run with the average temperature () of the cooling sleeve at the end of the four minute collection run being 1.667 o
- The 6 minute collection runs resulted in an average yield of 1.093g of EBC, an increase of 0.373g from the 4 minute collection runs with the average temperature () of the cooling sleeve at the end of the 6 minute collection run being 6.333 o
- The 8 minute collection runs resulted in an average yield of 1.476g of EBC, an increase of 0.383g from the fourth collection runs with the average temperature () of the cooling sleeve at the end of the eight minute collection run being 9.333 o
- The 10 minute collection runs resulted in an average yield of 1.700g of EBC, an increase of 0.223g from the 8 minute collection runs with the average temperature () of the cooling sleeve at the end of the ten minute collection run being 13 o


DISCUSSION:
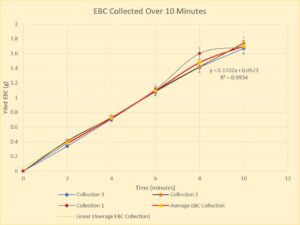
For the first 6 minutes, the condensate yield per minute was nearly constant at 0.180 ml/min for this particular subject for an average total collection of 1.093. between the 2 minute collection and the 4 minute collection the average EBC collection decreased by less than 0.013 ml/min but then returned to a similar value to the 0 to 2 minute collection. For the first collection between 6 and 8 minutes there was an unexpected, and inconsistent increase in EBC yield, followed by an inconsistent decrease in yield for the 8 to 10 minute period. This outlier skewed the average EBC collection for the listed intervals and could be attributed to numerous things. Despite the outlier being significant, the average collection maintained a linear relationship with time. This confirmed our hypothesis of a linear relationship between collection time and condensate yield. There was a marked spike in yield between 6 and 8 minutes, with an incremental yield of 0.191 ml over this period. Considering how all other data points, including the 10 minute collection values are very similar values, it can be assumed that there was an error in the collection resulting in a spike which caused the appearance of a fall-off during the 8 to 10 minute period of collection 1. This further suggests that, within the 10-minute range identified, collection temperature can rise 20oC during the collection duration and have essentially no effect on collection efficiency and condensate yield. A study done by the Clinical Chemistry and Laboratory Medicine journal suggested that exhaled breath vapor has significantly more condensation at temperatures below 4C (Ahmadzai et al, 2013)3. However, the distribution of condensate yield is linear even if this final variance is accounted for and with a p value < 0.005, these data suggest the collection efficiency is in fact constant over the entire temperature range of -7 oC to 13 oC thereby minimizing the effect of temperature in this range.
The spike in yield recorded could be attributed to a measurement error. It is likely the higher-than-expected yield recorded was due to measurement error because this was the only datapoint not consistent with the others. The scale was possibly not tared correctly, or the researcher made a subtle error when recording final mass.
For the plotted datapoints on Graph 1-1 for the yield of EBC during each collection, a line was fit to the points and a coefficient of determination (R2) was determined. R2 is the proportion of the variation in the dependent variable (yield EBC) that is predictable from the independent variable (time). The R2 value for this line was calculated as 0.993. This shows that the Graph 1-2 explains most of the variation in the outcome variable (yield EBC). Overall, a coefficient of determination of 0.993 shows that the model, Graph 1-2 does explain most of the variation in the outcome variable. The P-Value of < 0.005 also proves that collection is consistent over all temperatures in this experiment. The data, and the conditions of the study suggest that temperature had little effect on the overall efficiency of the RTube.
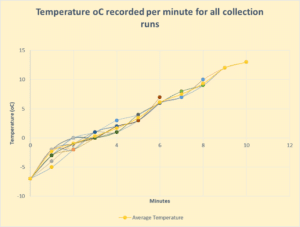
The graph above is a plot of all temperatures recorded per minute throughout the 3 collection groups and was done to show the linear relationship between temperature and time. Above there are 15 temperature points recorded at the 1 minute and 2 minute mark, 12 temperature points recorded at the 3 and 4 minute mark, 9 temperature points recorded at the 5 and 6 minute mark, 6 temperature points recorded at the 7 and 8 minute mark, and 3 temperature points at the 9 and 10 minute mark. This is because the first collection run only collected data for 2 minutes, the second collection only collected data for 4 minutes, the third collection run only collected data for 6 minutes, the fourth collection run only collected data for 8 minutes, and the fifth collection run collected data for 10 minutes. Every collection run had data recorded at 2 minutes, because all trials passed 2 minutes while proceeding to the max time for that trial. The first collections which ended at 2 minutes, would not have a 4,6,8, or 10 minute data point to record. This is why there are less data points as we progress to 10 minutes.
REFERENCES:
- Aytekin M, Dweik R, Grob N (2008) Biomarkers in exhaled breath condensate: a review of collection, processing and analysis. J. Breath Res. 2 037004 [J Breath Res. ]
- Andreoli R, Caglieri A, Corradi M, Goldoni M, Manini P, Mutti A, Poli D, Vettori M (2005) Influence of condensation temperature on selected exhaled breath parameters. BMC Pulm Med. 5(10) [BMC Pulonary Medicine]
- Ahmadzai, Hasib, Huang, Shuying, Hettiarachchi, Ravin, Lin, Jiun-Lih, Thomas, Paul S. and Zhang, Qi. (2013) Exhaled breath condensate: a comprehensive update” Clinical Chemistry and Laboratory Medicine, vol. 51, no. 7, 2013, pp. 1343-1361. [Clinical Chemistry and Laboratory Medicine Journal]
- Winters B, Pleil J, Angrish M, Stiegel M, Risby T, Madden M (2017) Standardization of the collection of exhaled breath condensate and exhaled breath aerosol using a feedback regulated sampling device. J Breath Res.11(4): 047107 [ J Breath